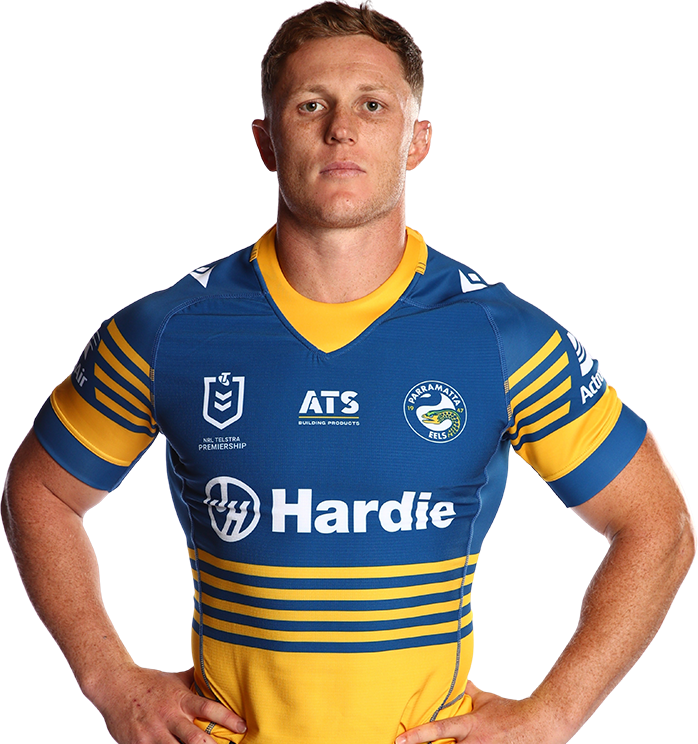
Jack Williams
2nd Row
Player Bio
- Height:
- 184 cm
- Date of Birth:
- 28 September 1996
- Weight:
- 98 kg
- Birthplace:
- Pambula, NSW
- Age:
- 29
- Nickname:
- Jacko
- Debut Club:
- Cronulla-Sutherland Sharks
- Date:
- 13 May 2018
- Opposition:
- Canberra Raiders
- Round:
- 10
- Previous Club:
- Cronulla-Sutherland Sharks
- Junior Club:
- -
- Biography:
Born in Pambula, NSW, Jack Williams began his rugby league journey with the Cooma Colts and attended Monaro High School. He progressed through the ranks, making 34 appearances in the NSW Cup for Mount Pritchard in 2016 and Newtown in 2017, 2018, and 2022.
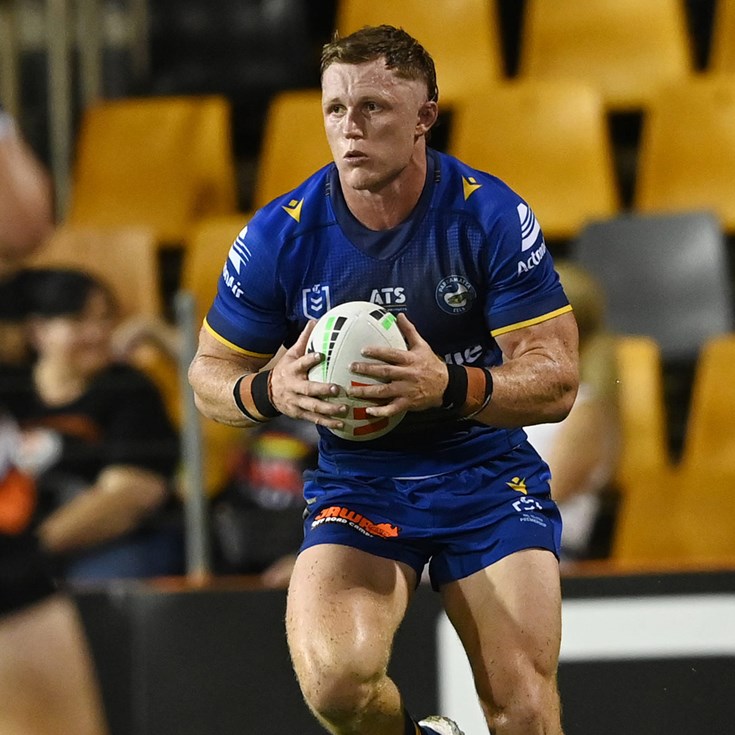
Williams made his NRL first-grade debut in 2018 for the Cronulla-Sutherland Sharks against the Canberra Raiders. Over his time with the Sharks, he played 124 games and scored 11 tries, establishing himself as a reliable and hard-working forward. In 2025, he joined the Parramatta Eels, where he quickly became an integral part of the team’s leadership group.
At the representative level, Jack earned selection for the Australia PM XIII in 2025, highlighting his recognition on the national stage. Known for his toughness, consistency, and leadership, Williams continues to make a significant impact both on and off the field.
Jack was awarded the club’s Ken Thornett Medal Player of the Year in 2025.
Career
- Appearances
- 162
- Tries
- 13
2026 Season
- Appearances
- 17
Scoring
- Tries
- 0
Attack
- Line Breaks
- 2
- Line Break Assists
- 1
Passing
- Offloads
- 9
Defence
- Tackles Made
- 678
- Tackle Efficiency
-
Running Metres
- Average Running Metres
- 113
- Total Running Metres
- 1928
Fantasy
- Total Points
- 879
- Average Points
- 51.7
2026 Season - By Round
| Round | Opponent | Score | Position | Minutes Played | Tries | Goals | 1 Point Field Goals | 2 Point Field Goals | Points | Try Assists | Linebreaks | Tackle Breaks | Post Contact Metres | Offloads | Receipts | Tackles Made | Missed Tackles | Total Running Metres | Hit Up Running Metres | Kick Return Metres | |
|---|---|---|---|---|---|---|---|---|---|---|---|---|---|---|---|---|---|---|---|---|---|
| 1 | Storm | Lost | 52 - 4 | 2nd Row | 80 | - | - | - | - | - | - | - | 1 | 40 | - | 12 | 44 | 1 | 95 | 95 | - |
| 2 | Broncos | Won | 32 - 40 | Prop | 52 | - | - | - | - | - | - | - | 3 | 39 | - | 11 | 37 | 2 | 102 | 84 | 18 |
| 3 | Dragons | Won | 30 - 20 | Prop | 63 | - | - | - | - | - | - | - | 2 | 41 | - | 14 | 50 | 5 | 93 | 93 | - |
| 4 | Panthers | Lost | 48 - 20 | Prop | 55 | - | - | - | - | - | - | - | 3 | 55 | - | 14 | 32 | 5 | 118 | 113 | 5 |
| 5 | Wests Tigers | Lost | 20 - 22 | Prop | 76 | - | - | - | - | - | - | - | - | 38 | - | 16 | 47 | 3 | 157 | 133 | 23 |
| 6 | Titans | Lost | 10 - 52 | Prop | 80 | - | - | - | - | - | - | - | 3 | 46 | 1 | 18 | 49 | 5 | 130 | 117 | - |
| 7 | Bulldogs | Won | 38 - 20 | 2nd Row | 80 | - | - | - | - | - | - | - | 2 | 35 | 1 | 10 | 41 | 1 | 76 | 76 | - |
| 8 | Sea Eagles | Lost | 33 - 18 | 2nd Row | 80 | - | - | - | - | - | - | - | 1 | 34 | - | 11 | 39 | 6 | 89 | 89 | - |
| 9 | Warriors | Lost | 14 - 36 | 2nd Row | 80 | - | - | - | - | - | - | - | - | 56 | 1 | 16 | 33 | 3 | 135 | 129 | - |
| 10 | Cowboys | Won | 30 - 33 | 2nd Row | 59 | - | - | - | - | - | 1 | - | 2 | 49 | - | 15 | 32 | 2 | 148 | 120 | 27 |
| 11 | Storm | Lost | 8 - 34 | 2nd Row | 62 | - | - | - | - | - | - | - | - | 23 | - | 12 | 37 | 2 | 85 | 51 | 27 |
| 13 | Knights | Lost | 28 - 22 | Prop | 74 | - | - | - | - | - | - | - | 4 | 46 | 2 | 18 | 36 | 3 | 131 | 131 | - |
| 14 | Bulldogs | Lost | 14 - 12 | Prop | 76 | - | - | - | - | - | - | 1 | 2 | 24 | - | 10 | 49 | 5 | 89 | 89 | - |
| 15 | Raiders | Won | 15 - 12 | Prop | 65 | - | - | - | - | - | - | - | - | 40 | 2 | 14 | 42 | 1 | 101 | 55 | 45 |
| 17 | Rabbitohs | Lost | 12 - 32 | Prop | 65 | - | - | - | - | - | - | - | 1 | 49 | - | 16 | 36 | 1 | 120 | 120 | - |
| 18 | Sea Eagles | Won | 23 - 14 | Prop | 63 | - | - | - | - | - | - | - | 3 | 57 | 1 | 19 | 23 | 4 | 144 | 133 | 11 |
| 19 | Roosters | Lost | 28 - 12 | Prop | 80 | - | - | - | - | - | 1 | 1 | 6 | 38 | 1 | 12 | 51 | 3 | 107 | 107 | - |
Career By Season
| Year | Played | Won | Lost | Drawn | Win % | Tries | Goals | 1 Point Field Goals | 2 Point Field Goals | Points | Kicking Metres | Kicking Metres Average | Forced Drop Outs | Linebreaks | Offloads | Tackles Made | Missed Tackles | Tackle Efficiency | Total Running Metres | Average Running Metres | Kick Return Metres | Total Points | Average Points | |
|---|---|---|---|---|---|---|---|---|---|---|---|---|---|---|---|---|---|---|---|---|---|---|---|---|
| Sharks | 2018 | 4 | 3 | 1 | - | 75% | 1 | - | - | - | 4 | - | - | - | - | - | 93 | 11 | 89.42% | 315 | 78.00 | 44 | 119 | 29.8 |
| Sharks | 2019 | 24 | 12 | 12 | - | 50% | 2 | - | - | - | 8 | 40 | 1.68 | 1 | 3 | 7 | 542 | 43 | 92.65% | 2,352 | 98.00 | 384 | 759 | 31.6 |
| Sharks | 2020 | 17 | 8 | 9 | - | 47% | 2 | - | - | - | 8 | - | - | - | - | 2 | 385 | 34 | 91.89% | 1,492 | 87.00 | 74 | 476 | 28.0 |
| Sharks | 2021 | 24 | 10 | 14 | - | 42% | 2 | - | - | - | 8 | 2 | 0.09 | - | 2 | 4 | 598 | 45 | 93.00% | 2,885 | 120.00 | 406 | 936 | 39.0 |
| Sharks | 2022 | 6 | 3 | 3 | - | 50% | - | - | - | - | - | - | - | - | - | 1 | 90 | 2 | 97.83% | 386 | 64.00 | 111 | 124 | 20.7 |
| Sharks | 2023 | 24 | 13 | 11 | - | 54% | 2 | - | - | - | 8 | 19 | 0.78 | - | 5 | 4 | 564 | 39 | 93.53% | 2,324 | 96.00 | 140 | 839 | 35.0 |
| Sharks | 2024 | 25 | 16 | 9 | - | 64% | 2 | - | - | - | 8 | - | - | - | 2 | 6 | 683 | 46 | 93.69% | 2,482 | 99.00 | 148 | 921 | 36.8 |
| Eels | 2025 | 21 | 9 | 12 | - | 43% | 2 | - | - | - | 8 | 1 | 0.03 | - | 7 | 11 | 712 | 56 | 92.71% | 2,712 | 129.00 | 144 | 1,046 | 49.8 |
| Eels | 2026 | 17 | 6 | 11 | - | 35% | - | - | - | - | - | - | - | - | 2 | 9 | 678 | 52 | 92.88% | 1,928 | 113.00 | 159 | 879 | 51.7 |
Career Overall
| Year Start | Year End | Played | Won | Lost | Drawn | Win % | Tries | Goals | 1 Point Field Goals | 2 Point Field Goals | Points | Kicking Metres | Kicking Metres Average | Forced Drop Outs | Linebreaks | Offloads | Tackles Made | Missed Tackles | Tackle Efficiency | Total Running Metres | Average Running Metres | Kick Return Metres | Total Points | Average Points | |
|---|---|---|---|---|---|---|---|---|---|---|---|---|---|---|---|---|---|---|---|---|---|---|---|---|---|
| Sharks | 2018 | 2024 | 124 | 65 | 59 | - | 52% | 11 | - | - | - | 44 | 61 | 0.49 | 1 | 12 | 24 | 2,955 | 220 | 93.07% | 12,239 | 98.00 | 1,310 | 4,174 | 33.7 |
| Eels | 2025 | 2026 | 38 | 15 | 23 | - | 39% | 2 | - | - | - | 8 | 1 | 0.02 | - | 9 | 20 | 1,390 | 108 | 92.79% | 4,640 | 122.00 | 303 | 1,925 | 50.7 |
Latest


Team Mates


Parramatta Eels respect and honour the Traditional Custodians of the land and pay our respects to their Elders past, present and future. We acknowledge the stories, traditions and living cultures of Aboriginal and Torres Strait Islander peoples on the lands we meet, gather and play on.